
The Library — browse and select your datasets
The Library is the table of every dataset in the project. It is where you browse, sort, flag, and select datasets, launch batch processing, and preview a dataset's overview images. A toolbar sits along the top; below it a splitter divides the dataset table (left) from a preview panel (right).
The numbered markers on the screenshot below point to each region; the legend that follows explains them. The small ? button at the far right of the toolbar (just past the selection summary) opens this page.
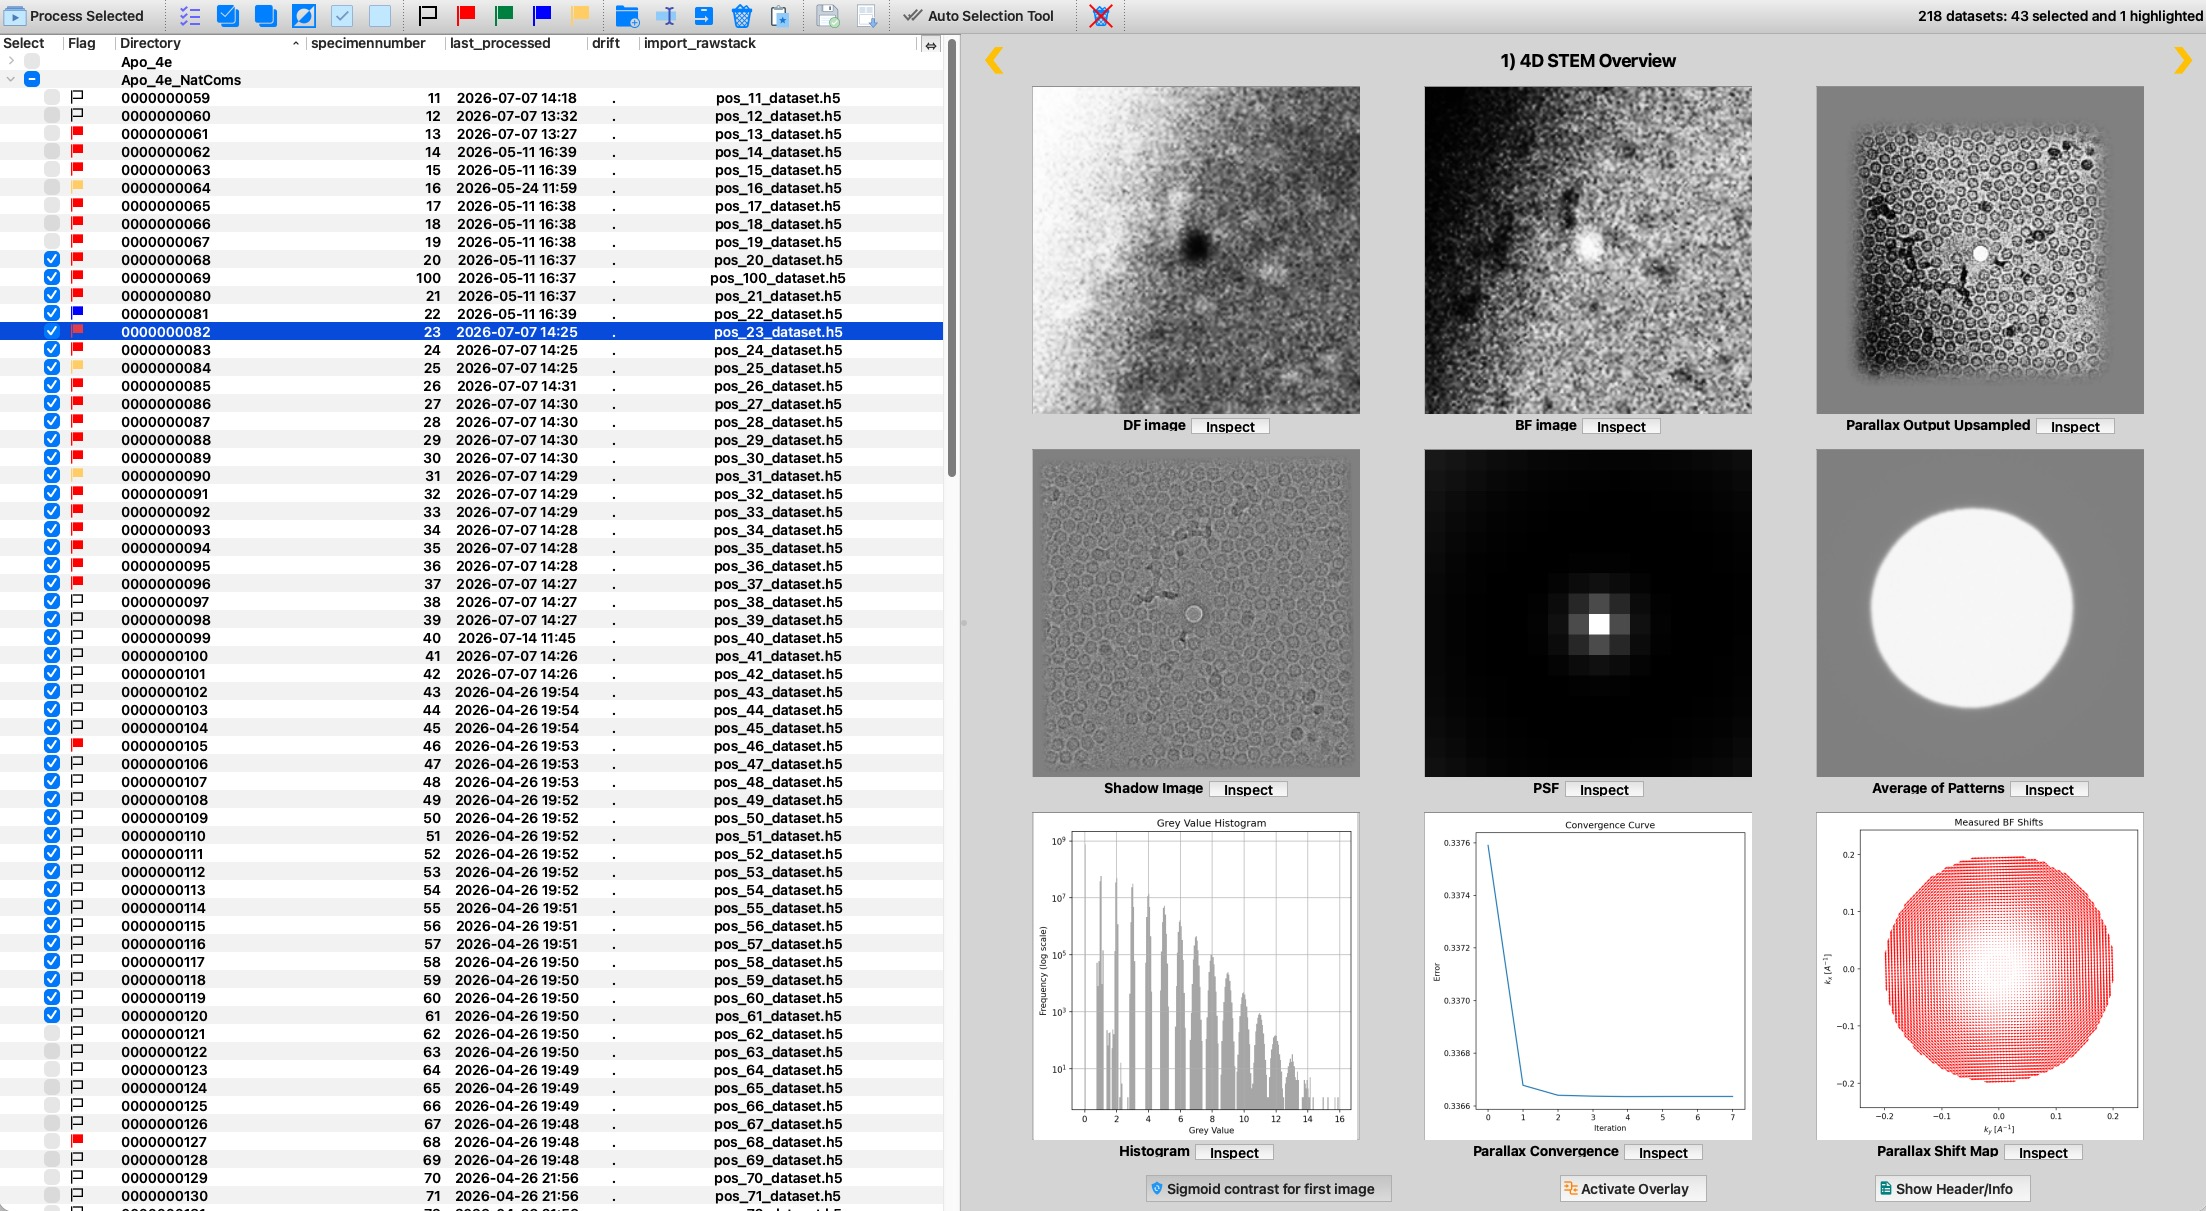 1
2
3
4
5
6
7
8
9
10
11
1
2
3
4
5
6
7
8
9
10
11
| # | Region | What it is and does |
|---|---|---|
| 1 | Process Selected | Adds the checked datasets to the parallel AutoProcess batch queue for processing. |
| 2 | Selection tools | Show selected only, Select All, Deselect All, Invert selection, and Select / Remove the highlighted rows from the checked set. |
| 3 | Flag tools | Set the flag colour (none / red / green / blue / gold) on the currently highlighted rows. |
| 4 | Group & file operations | Add and rename image groups, move highlighted datasets to another group, trash them, copy to a second project, save/load a selection list, and empty the trash. |
| 5 | Auto Selection Tool | Opens a bar that auto-checks the datasets whose chosen parameter falls in a numeric range (optionally filtered by flag colour). |
| 6 | Selection summary | A live count — "N datasets: X selected and Y highlighted". The ? help button sits just to its right. |
| 7 | Select column | The check-box for each dataset. The set of checked boxes is the selected set that Process Selected acts on. |
| 8 | Flag column | Shows each dataset's flag colour (a coloured marker), set with the flag tools (3). |
| 9 | Column headers | Every other column (Directory, specimen number, last processed, drift, raw stack, …). Click a header to sort by it (click again to reverse); drag headers to reorder them; the ⇔ toggle at the far right switches column widths between fitting the values and fitting the full names; right-click a header to show/hide individual columns. |
| 10 | Highlighted row(s) | The rows currently selected in the view (shown in blue). The flag, move and trash actions operate on these highlighted rows. |
| 11 | Preview panel | The overview images of the current dataset (dark-field, bright-field, parallax, shadow, PSF, average pattern, histograms, …), each with an Inspect button. Arrows step to the previous/next dataset, and the buttons below adjust contrast, overlay, and show the file header. |
Working with the table
Sorting and arranging columns
The table can be sorted by any column — click the column header to sort ascending, click again to reverse. Rows stay grouped by their image group. You can drag column headers to reorder the columns, right-click a header to show or hide individual columns, and use the ⇔ toggle at the right end of the header row to switch each column's width between "fit the values" and "fit the full parameter name". Which columns appear (and their order) is remembered per program mode and can also be configured in Preferences ▸ LibraryTable.
Highlighted vs. selected — two different things
4d distinguishes two independent notions, and the toolbar summary (6) shows both counts:
- Highlighted — the rows you have clicked in the view (normal click, or Shift/Ctrl-click for a range or multiple). Highlighting is just the current focus in the table; the flag, move and trash actions operate on the highlighted rows.
- Selected — the state of the Select check-boxes (7). This is the set that gets processed. You can build it directly by ticking boxes, or from the highlighted rows with the selection tools (2), or automatically with the Auto Selection Tool (5).
In short: highlighting is what you are looking at; selecting (checking) is what you will process.
Submitting datasets for batch processing
Tick the datasets you want in the Select column, then press Process Selected (1). The checked datasets are handed to the parallel AutoProcess queue, which runs the configured scripts on them concurrently. While the queue runs, the matching rows animate through their queued and processing states.
Opening a dataset
Double-click a dataset to open it in the Manual Processing tab, where you can run individual scripts on it interactively and inspect its parameters, logs and result images. Single-clicking only highlights the row and updates the preview panel (11).