← Back to the Library tab · Library page · Fibril processing scripts
The maximized inspection view
In the Library tab, each dataset is shown as a small preview panel. Pressing a panel's Inspect button (or right-clicking the image and choosing Inspect) maximizes that image: it fills the whole Library area, a row of image-adjustment controls appears above it, and — with the FFT button enabled — a live Fourier transform of the region under the mouse is shown to its right. Press Esc (or Inspect again) to return to the panel grid.
This view is where fibril picking is done in projects running in
Fibril mode (project mode 7): you mark filaments on the
micrograph by clicking their two end points, sorted into up to five categories,
and 4d writes them to .star files that the
fibril processing scripts pick up.
The window, region by region
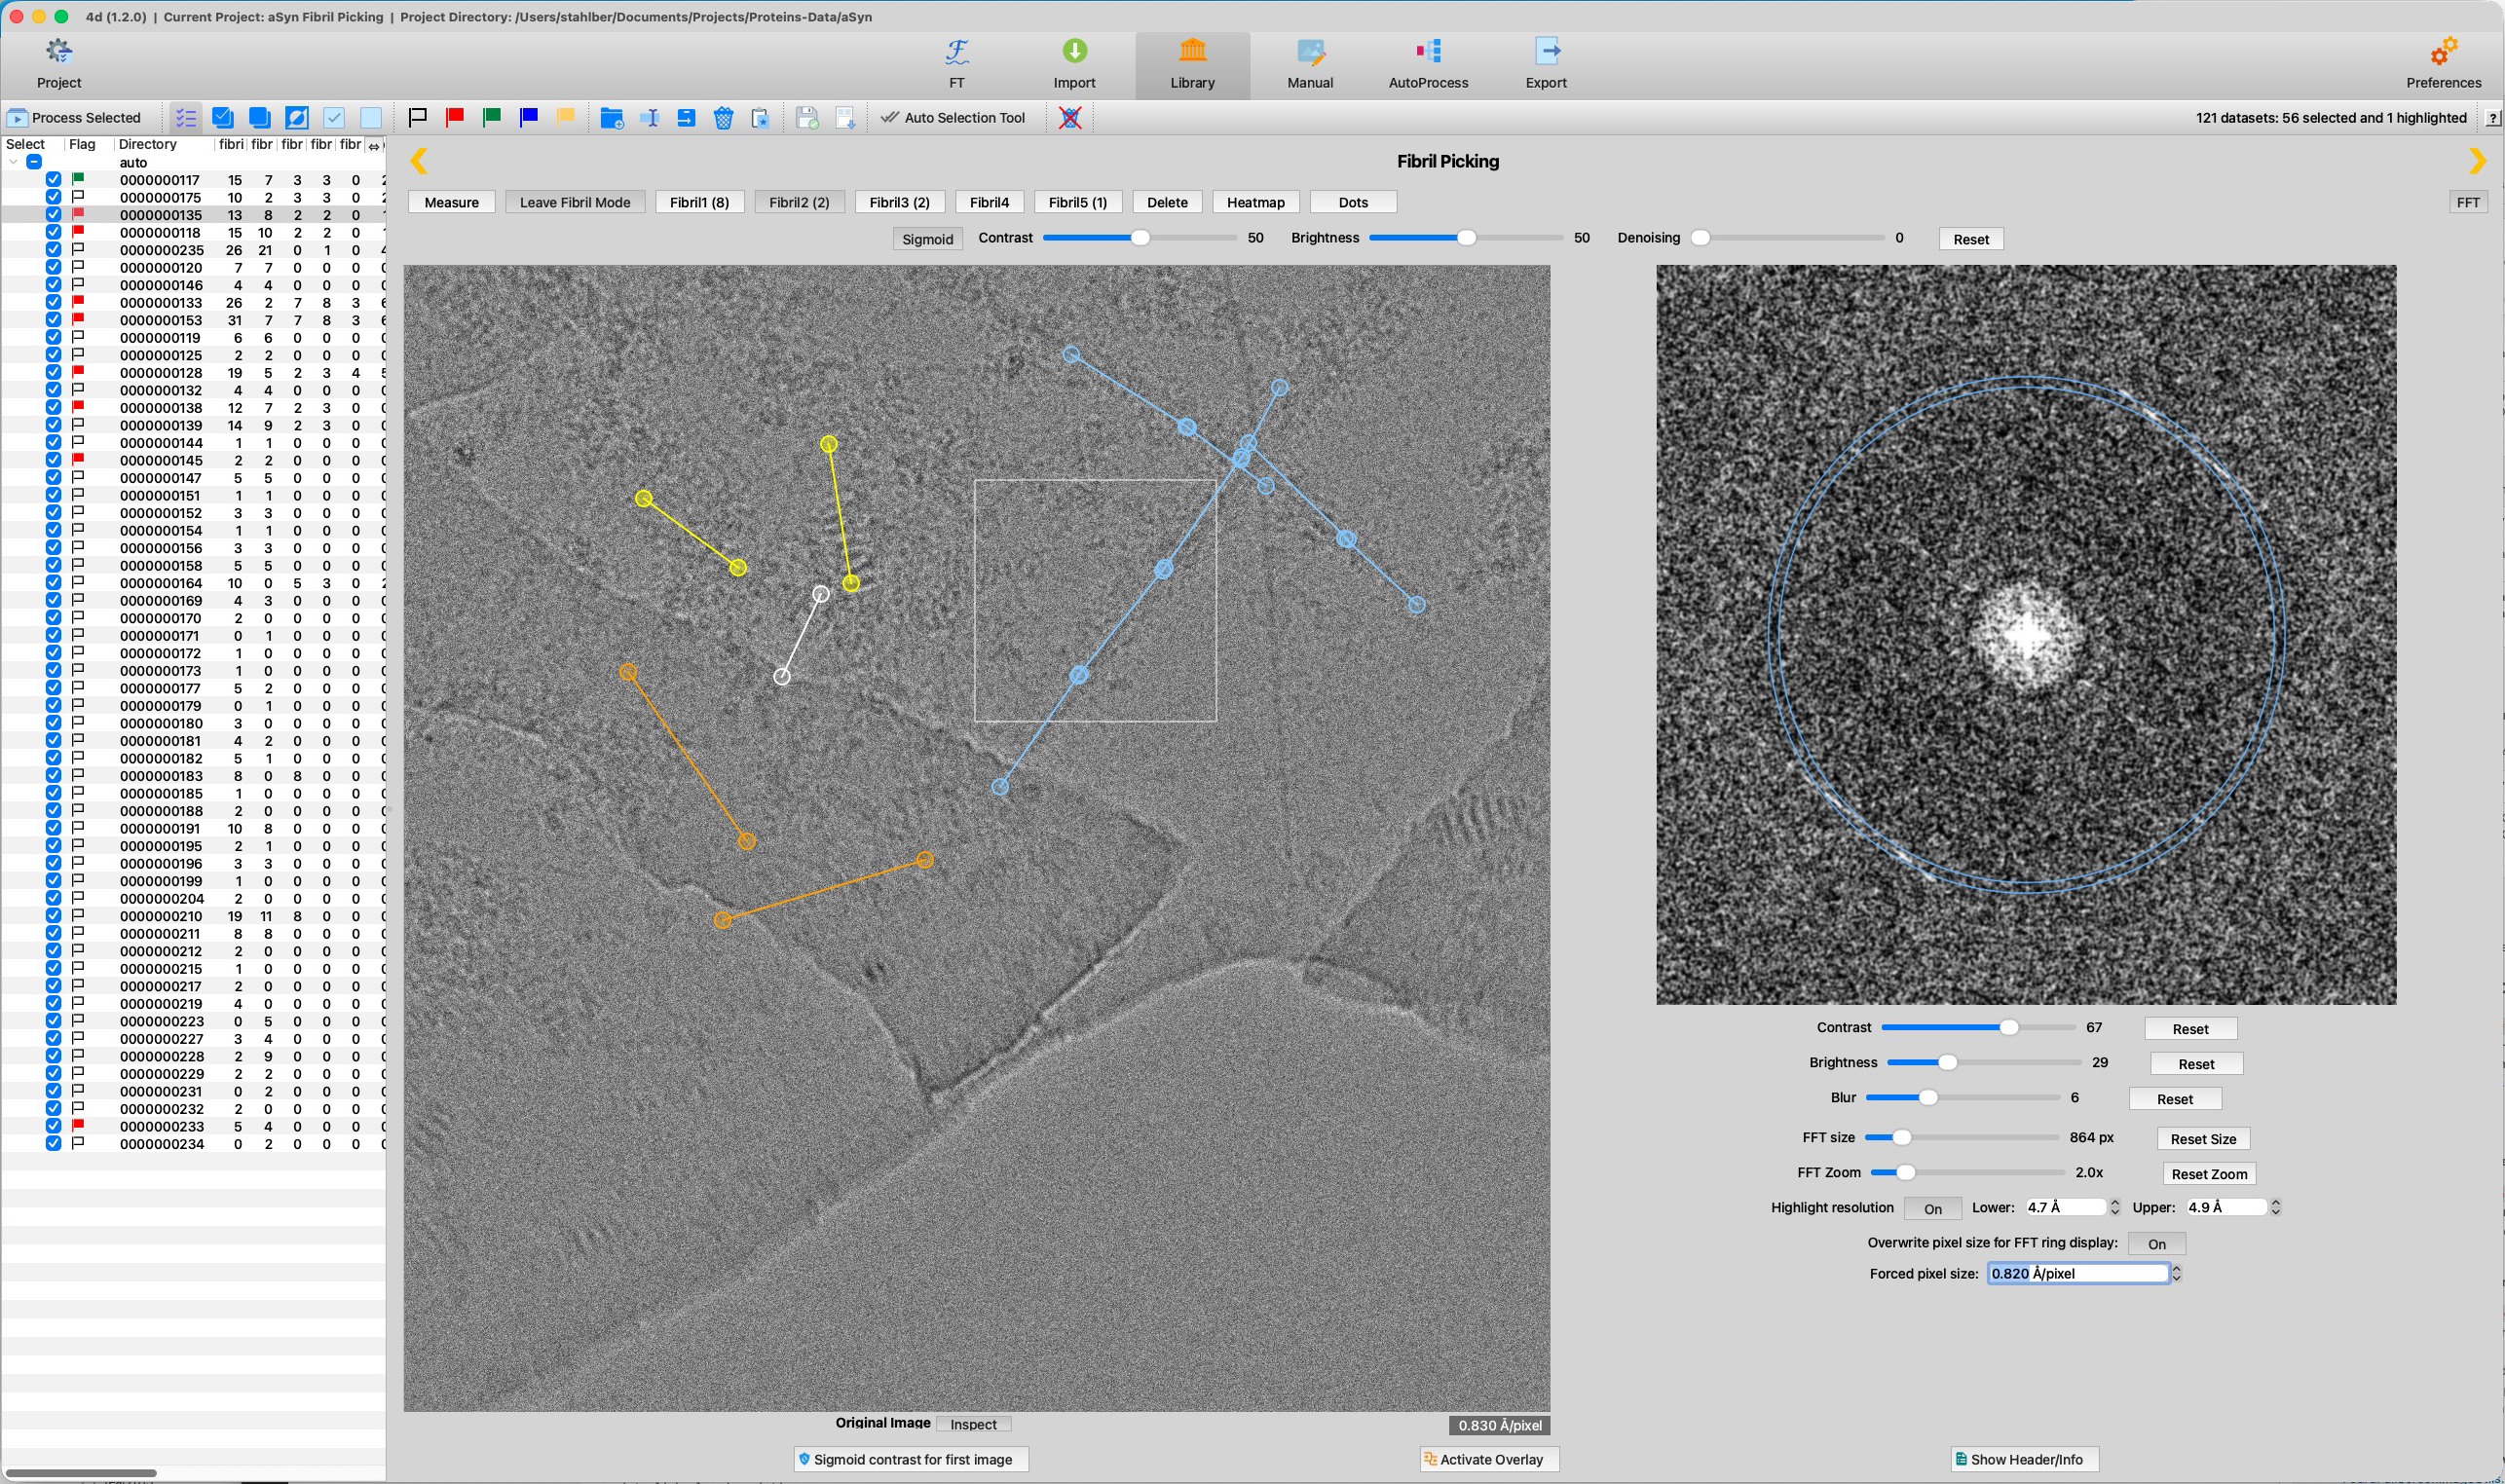
The screenshot below shows the maximized view of a cryo-EM micrograph with fibril picking active and the live FFT displayed on the right. Each region is marked with a number; the legend that follows explains what each one is and does.
 1
2
3
4
5
6
7
8
9
10
11
12
13
14
15
16
17
18
1
2
3
4
5
6
7
8
9
10
11
12
13
14
15
16
17
18
| # | Region | What it is and does |
|---|---|---|
| 1 | Library table | The dataset table stays visible on the left. The highlighted row is the maximized image; the fibril… columns show the pick counts per category. Selecting another row loads it into the maximized view. |
| 2 | ‹ › navigation arrows | Step to the previous / next dataset without leaving the maximized view — same as the ↑/↓ arrow keys. |
| 3 | Title | The current mode ("Fibril Picking") or the dataset name. |
| 4 | Measure | Measuring tool: click two points in the image to read out their distance (shown next to the button, in Å using the current pixel size). While measuring, fibril picking is suspended. |
| 5 | Activate / Leave Fibril Mode | The master switch for fibril picking. Activating it reveals the Fibril1–5, Delete, Heatmap and Dots buttons; leaving it hides them again and deactivates any picking category. |
| 6 | Fibril1 … Fibril5 & Delete | The five pick categories — exactly one can be active at a time, and clicks in the image add fibrils to it. Each button shows its current count, e.g. Fibril1 (8). Delete (also Del/Backspace) removes all fibrils of the active category for this image. |
| 7 | Heatmap / Dots | Overlay the results of the fibril analysis scripts: the Heatmap (shortcut H) and the fibril Dots map (shortcut D). See the example below. |
| 8 | FFT button & ? help | FFT switches on the live Fourier transform of the image region under the mouse cursor (region 14). The small square ? button to its right opens this manual page. |
| 9 | Image adjustments | Sigmoid (tone curve with midpoint = median, width = 4×std), Contrast and Brightness sliders (50 = neutral). They change the display only — never the data on disk. |
| 10 | Denoising & Reset | A denoising filter (0 = off) for easier visual identification of filaments, and Reset to return all adjustments to their defaults. |
| 11 | Micrograph | The maximized image. In fibril mode, left-click sets a fibril's start point and a second left-click its end point; right-click on an existing fibril deletes it (or cancels a half-drawn one). |
| 12 | Picked fibrils & FFT patch | Each picked fibril is drawn as a line with circular end markers, colour-coded by category. The white square marks the patch currently used for the live FFT — it follows the mouse. |
| 13 | Image footer | The image label with its Inspect button (leaves the maximized view), and the pixel size (Å/pixel) of the displayed image. |
| 14 | Live FFT | The Fourier transform of the patch under the cursor, updated as you move the mouse. For amyloid fibrils, the layer-line signal near 4.7–4.9 Å is what you are looking for — a good indicator of whether a filament is worth picking. |
| 15 | Resolution rings | Rings drawn at the resolution band set below (highlighted here at 4.7–4.9 Å, the amyloid cross-β spacing). Toggle them with F. |
| 16 | FFT display controls | Contrast, Brightness and Blur for the FFT display, each with its own Reset. |
| 17 | FFT size & zoom | The patch edge length in pixels (also settable with the scroll wheel over the image) and the zoom of the FFT display, each with a reset button. |
| 18 | Resolution & pixel size | Highlight resolution On/Off with the Lower/Upper bounds of the highlighted band, and — via Overwrite pixel size for FFT ring display — a Forced pixel size in Å/pixel, for when the value stored with the dataset is wrong or missing. |
Heatmap and Dots overlays
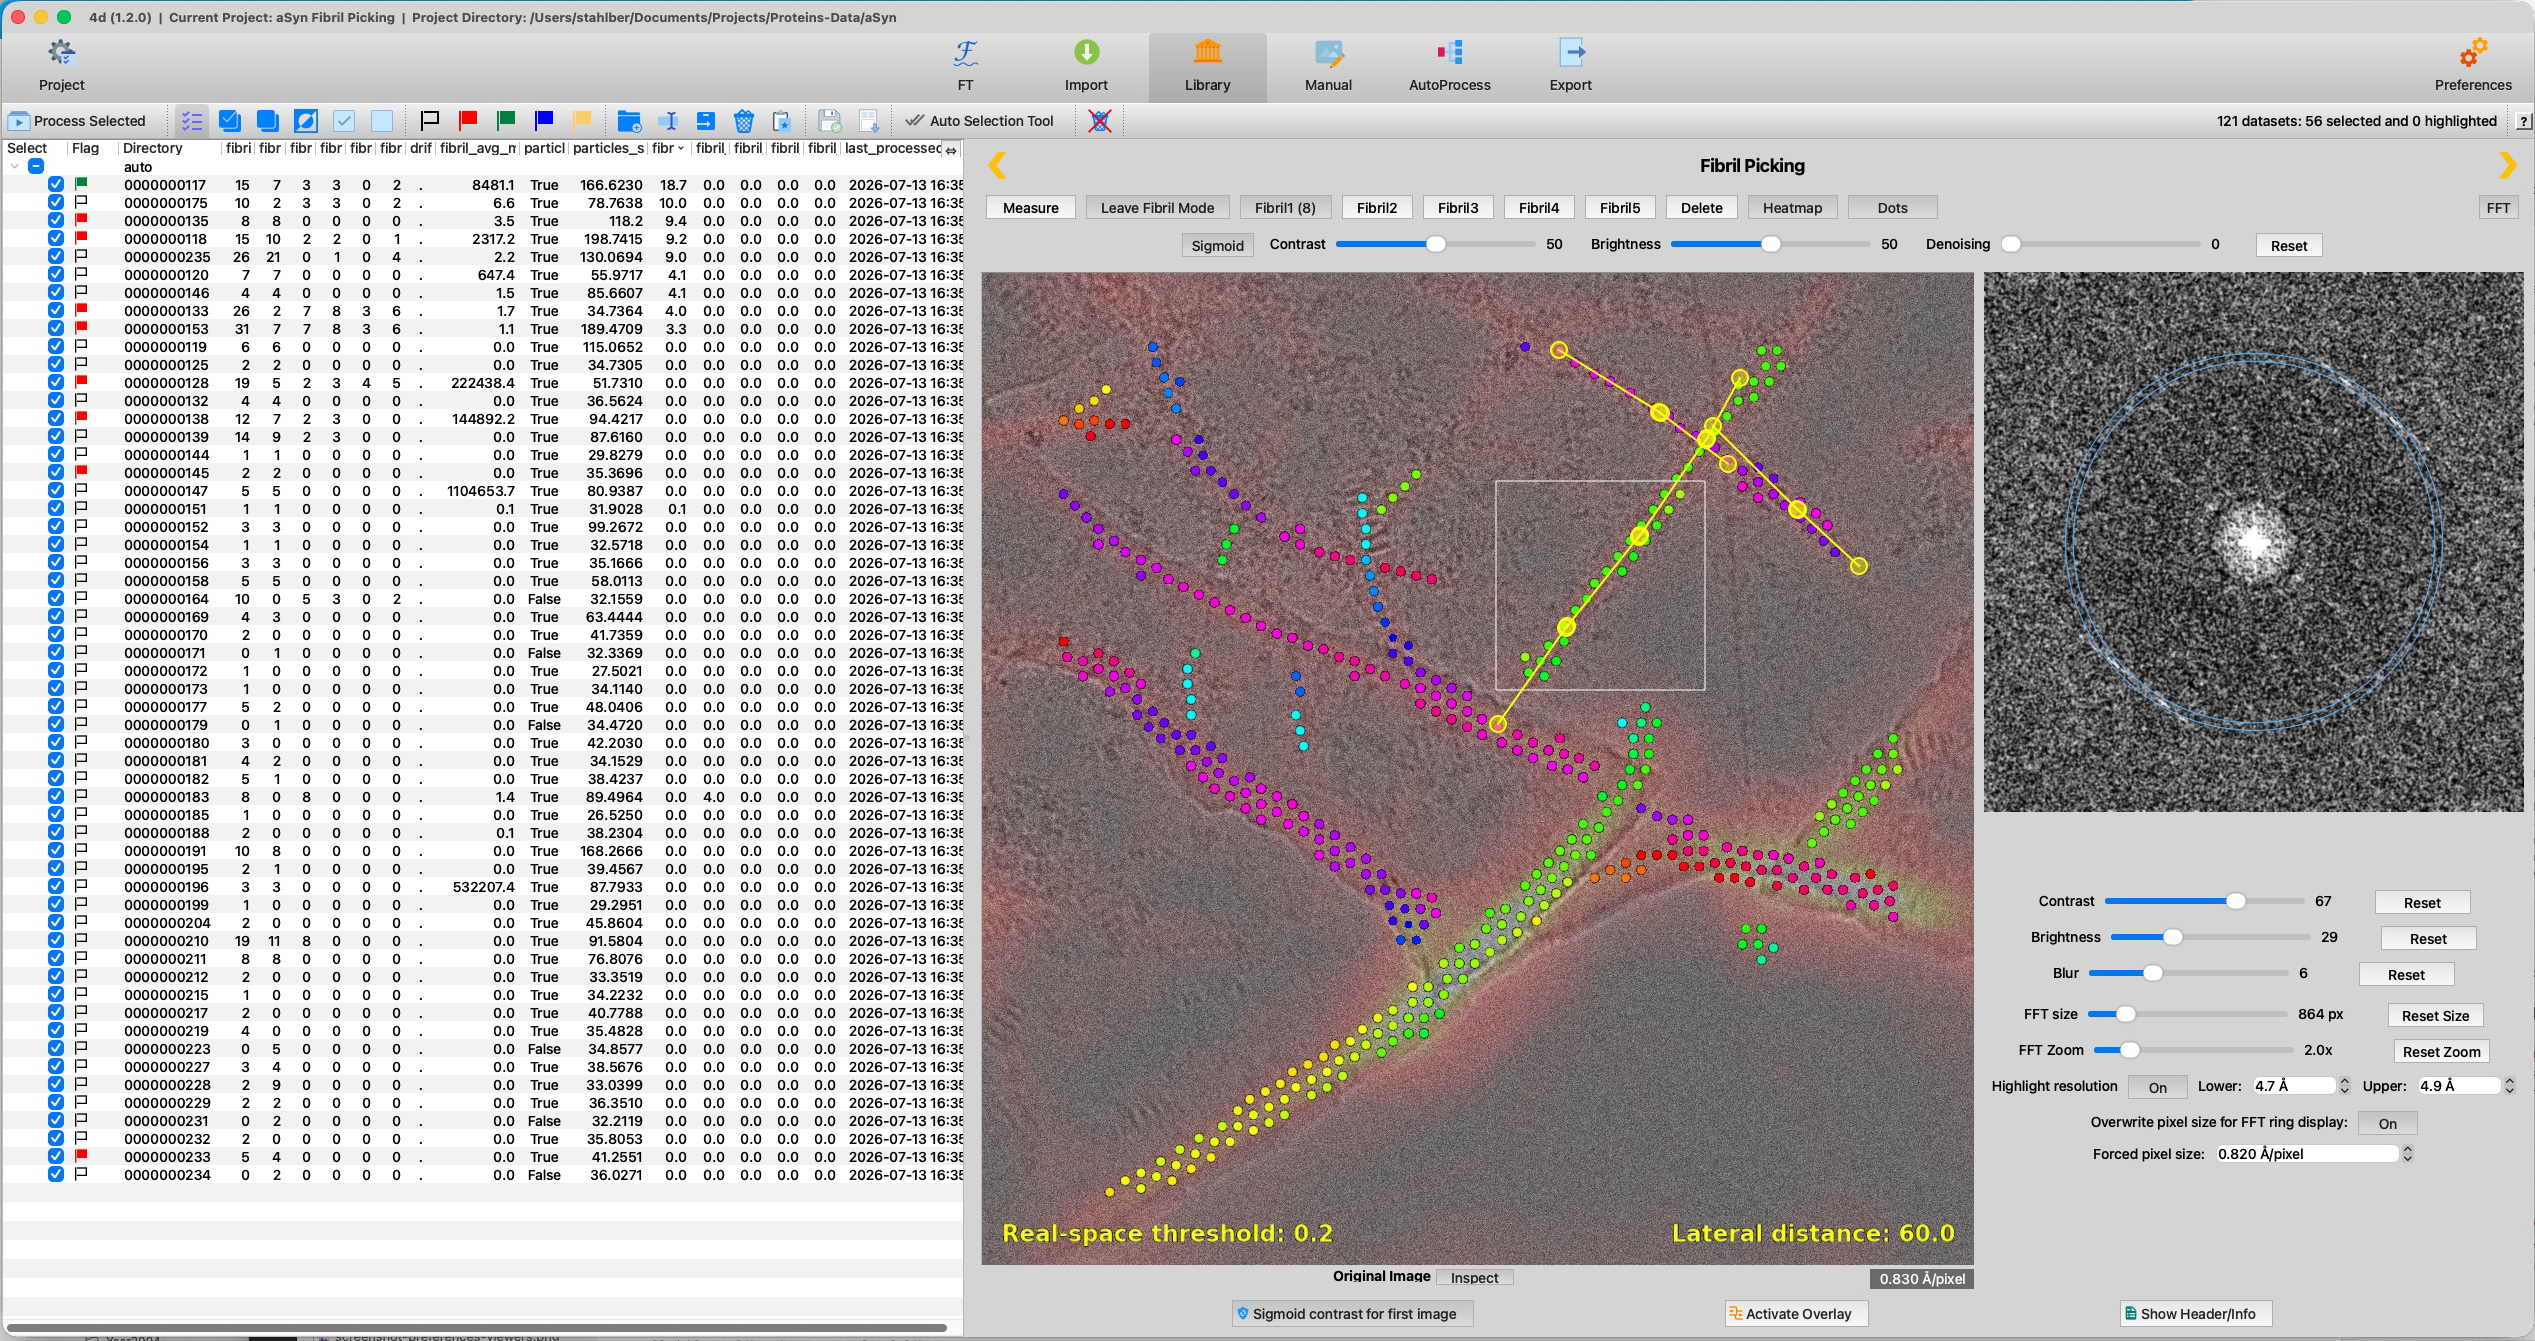
Once the fibril analysis scripts have run, their results can be displayed directly on the micrograph: the Heatmap button (shortcut H) overlays the real-space filament-likelihood map, and the Dots button (shortcut D) overlays the detected filament trace points, colour-coded per detected filament. Both overlays combine with your own manual picks, so you can immediately see where automatic detection and manual picking agree.
 1
2
3
4
5
6
1
2
3
4
5
6
| # | Region | What it is and does |
|---|---|---|
| 1 | Heatmap (active) | Overlays fibrilpicker_heatmap.jpg — the reddish real-space map of where the analysis considers filament density to be high. |
| 2 | Dots (active) | Overlays fibrilpicker_fibril_dot_map.jpg — the traced filament points, with one colour per detected filament. |
| 3 | Detected filament traces | The coloured dot chains follow individual detected filaments; their colour distinguishes neighbouring filaments so crossings stay readable. |
| 4 | Manual picks on top | Your own picks (here yellow) stay visible above the overlays — the direct visual comparison between manual and automatic picking. |
| 5 | Real-space threshold | The threshold the displayed heatmap was computed with (a parameter of the fibril analysis script). |
| 6 | Lateral distance | The lateral filament distance used by the analysis, in pixels. |
Picking fibrils, step by step
- Maximize an image. In the Library table, press the Inspect button of a preview panel (or right-click the image → Inspect).
- Improve visibility. Adjust Contrast, Brightness, Sigmoid and Denoising until the filaments stand out. These affect only the display.
- Check the pixel size. The footer shows the Å/pixel of the image. If it is wrong or missing, enable Overwrite pixel size for FFT ring display and enter the correct Forced pixel size — the resolution rings depend on it.
- Switch on the FFT. Press FFT, set the Highlight resolution band (e.g. 4.7–4.9 Å for amyloid), and hover over a candidate filament: a clear layer line in that band means the filament is well ordered. Scroll over the image to change the patch size.
- Activate Fibril Mode and choose a category (Fibril1…Fibril5) — e.g. one per morphology or per confidence level.
- Pick. Left-click one end of a filament, then its other end. The fibril is drawn and saved immediately. Right-click a fibril to delete it; right-click during drawing cancels it.
- Correct if needed. Delete (or Del/Backspace) clears all fibrils of the active category in this image.
- Move on. Press ↓ for the next dataset — picking stays active, so you can work through a session quickly. Press Esc when done.
- Compare with the automatic analysis. After running the fibril scripts, switch on Heatmap (H) and Dots (D) to check your picks against the detection.
Picks are stored as STAR files in the dataset's fibrilpicker/
directory — fibrils.star for category 1 and
fibrils2.star…fibrils5.star for categories 2–5 —
written on every change, so there is no separate save step. The per-category
counts also appear in the fibril… columns of the Library table.
Keyboard and mouse
| Key / action | Effect |
|---|---|
| ↑ / ↓ | Previous / next dataset, staying in the maximized view. |
| Esc | Leave the maximized view and return to the panel grid. |
| H | Toggle the heatmap overlay. |
| D | Toggle the dots overlay. |
| F | Toggle the FFT resolution rings (requires the FFT to be on). |
| Del / Backspace | Delete all fibrils of the active category in this image. |
| Left-click (fibril mode) | Set a fibril's start point, then its end point. |
| Right-click (fibril mode) | Delete the fibril under the cursor, or cancel a half-drawn one. |
| Mouse move | Moves the FFT patch — the live FFT follows the cursor. |
| Scroll wheel | Change the FFT patch size. |
| Double-click (outside fibril mode) | Open the image in the external viewer. |