
← Back to the Manual Processing tab
Manual Processing — run scripts on one dataset
The Manual Processing tab is where you run individual processing scripts on a single dataset and watch the result. You open a dataset here by double-clicking it in the Library; it appears as a closable tab. You then pick a script category on the left, choose a script, set its parameters, press Run, and inspect the log, computed values and result images.
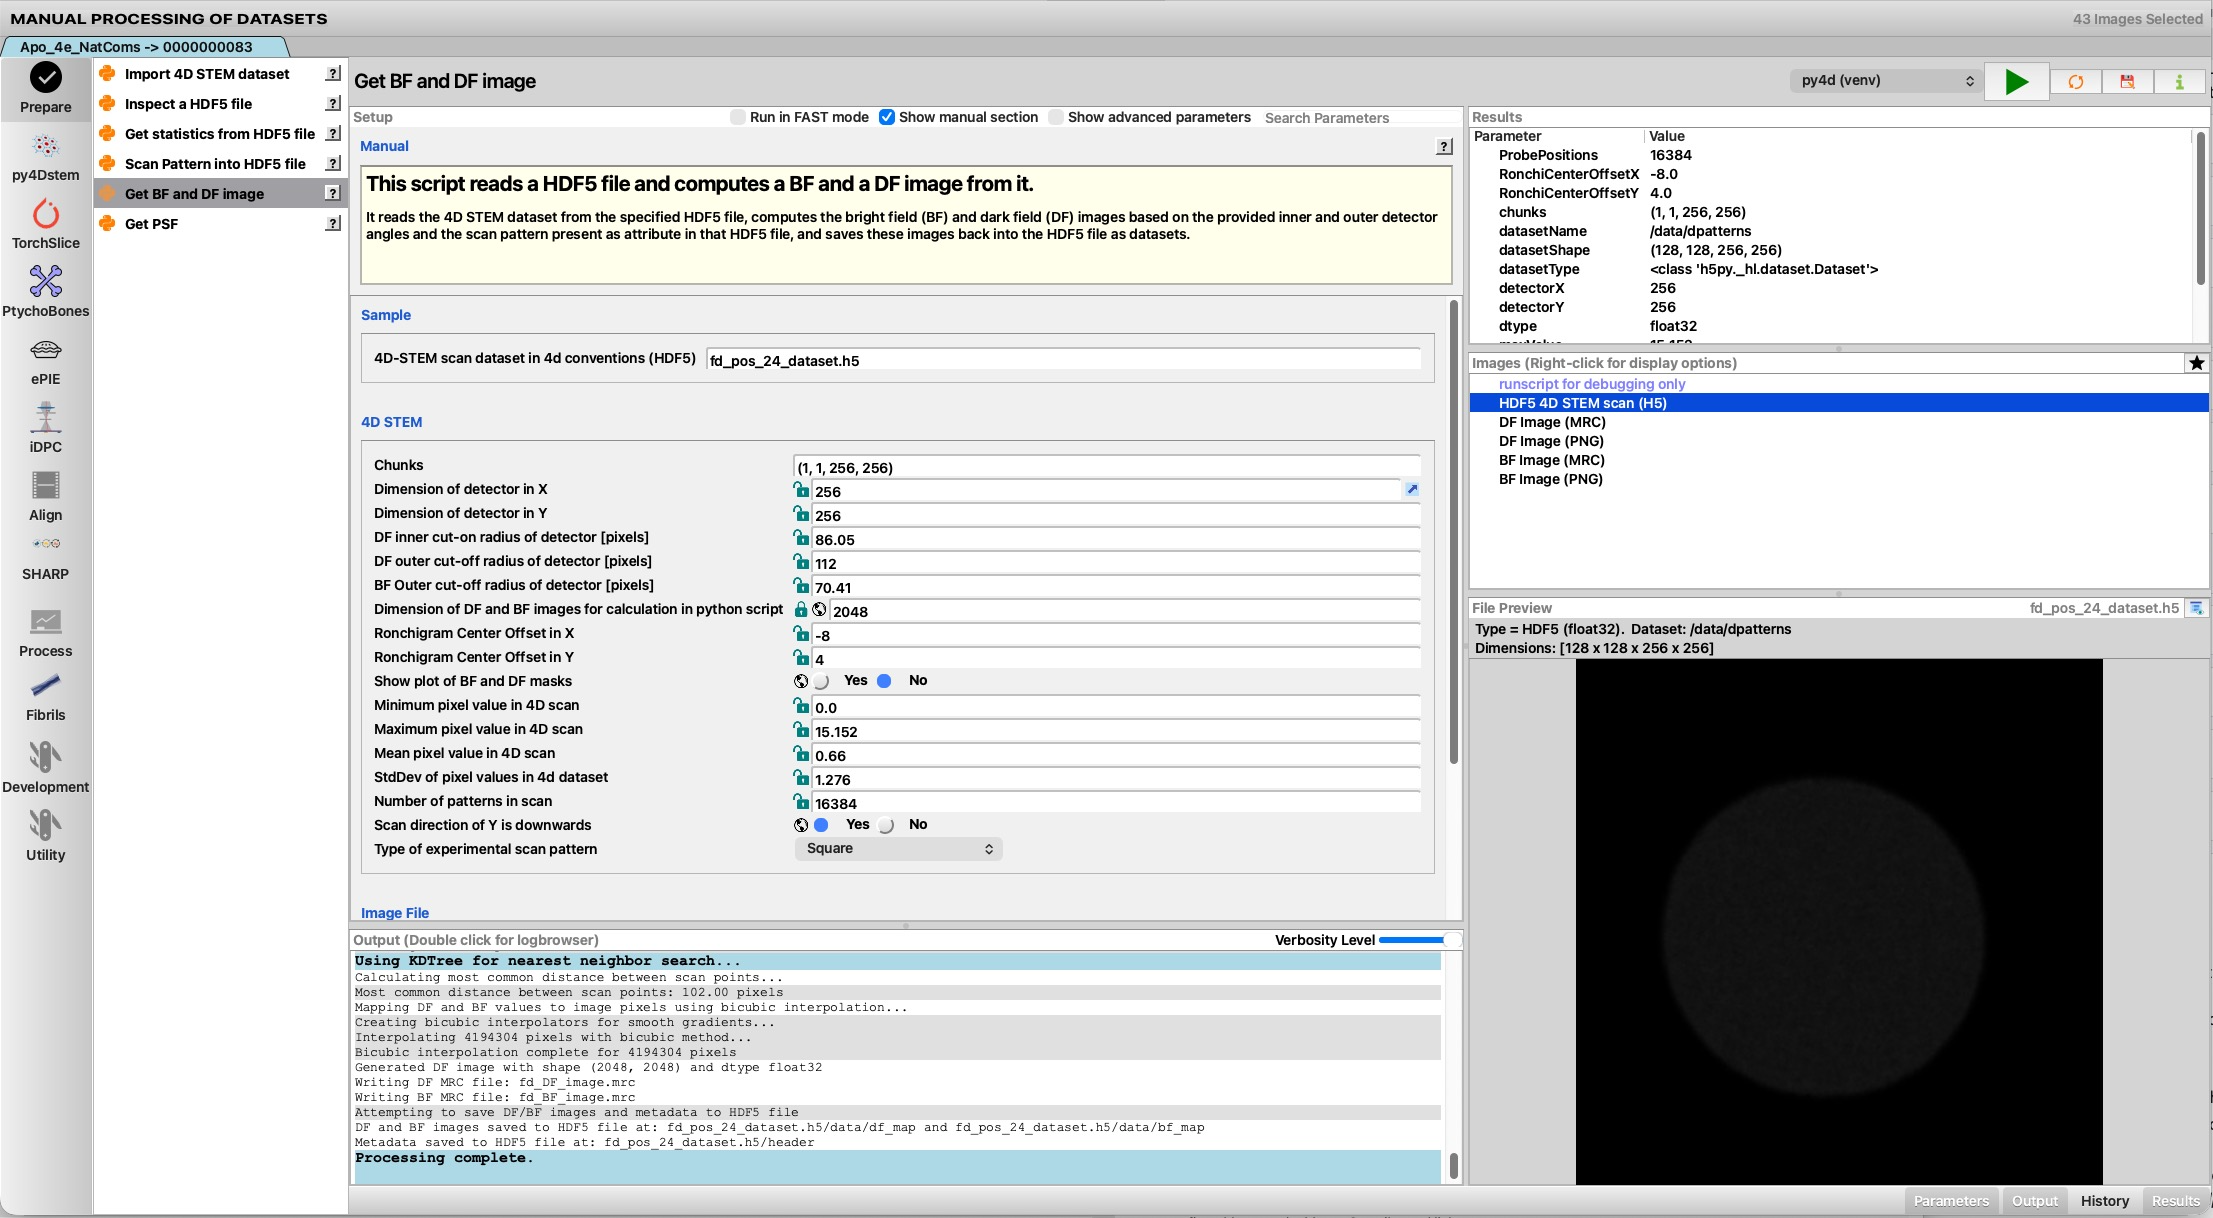
The numbered markers on the screenshot below point to each region; the legend that follows explains them. The ? button at the top-right of the window (where the dataset count normally sits) opens this page.
 1
2
3
4
5
6
7
8
9
10
11
12
13
1
2
3
4
5
6
7
8
9
10
11
12
13
| # | Region | What it is and does |
|---|---|---|
| 1 | Dataset tab | Each dataset you open (by double-clicking it in the Library) becomes a closable tab here. A tab turns green with a running icon while its script executes and cannot be closed until it finishes. |
| 2 | Script categories | The vertical rail of script modules — Prepare, py4Dstem, TorchSlice, PtychoBones, ePIE, iDPC, Align, SHARP, Process, Fibrils, Development, Utility. Pick a category to list its scripts. (See the processing sections for what each contains.) |
| 3 | Script list | The scripts in the selected category. Each row has a Python (.py) or C-shell (.csh) icon, and — when the script declares a help target — a small ? button at the right that opens that script's manual page. |
| 4 | Script name | The title of the selected script. |
| 5 | Action buttons | From left: the Python-environment selector (for Python scripts), the Run/Stop button, Reload & save results, and Save this configuration as project default. A progress bar fills the title while a script runs. |
| 6 | Setup toggles | Run in FAST mode (sets fast_mode for the script), Show manual section, Show advanced parameters, and a Search Parameters box. |
| 7 | Manual section | The selected script's own help text (from its # MANUAL: lines). Its ? opens the script's manual page. Hide it with the toggle in (6). |
| 8 | Parameters | The script's parameters, grouped into sections (e.g. Sample, 4D STEM, Image File). Edit the values here before running; a lock icon marks locked or global (project-wide) parameters. |
| 9 | Output | The live standard-output/error log. The Verbosity Level slider chooses how much is shown — None / Low / Medium / High (the three verbosities plus off). Double-click to open the external log browser. |
| 10 | Results | A Parameter → Value table of the values the script wrote back (e.g. detector dimensions, statistics, computed geometry). |
| 11 | Images | The result images the script produced. Right-click for display options (open in the viewer or the Fourier Analyzer, or reveal in the file system); the ★ toggle shows important images only. |
| 12 | File Preview | A preview of the selected result file with its header / file information. |
| 13 | Panel buttons | Show or hide the Parameters, Output, History and Results panels. |
Running a script
- Open a dataset by double-clicking it in the Library — it opens as a tab here (1).
- Choose a category (2) and then a script (3). Its manual text (7) and parameters (8) fill in.
- Pick the Python environment (5) if the script is a Python script, and set the parameters (8) — turn on Show advanced parameters (6) if you need the less common ones.
- Press Run (5). The log streams into Output (9); raise the Verbosity Level to see more detail.
- Inspect the results: computed values in Results (10), output images in Images (11) — right-click one to open it in the viewer or Fourier Analyzer — and the header/preview in File Preview (12).
- Optionally save the parameters as the project default (5) so the next dataset starts from them.
The same scripts run in batch across many datasets from the
AutoProcess tab — Manual Processing is
for running and tuning them interactively on one dataset at a time.